Making IoT tech “farmer-friendly” with dizmo
We had the infinite privilege to participate in the fabulous Future Hacks Internet of Things Edition hackathon in Madrid at the weekend, jointly sponsored between IBM, Dizmo, Vodafone, BQ and IE Business School.
What did catch the eye, and makes for an interesting blog post, was the concept which won the “Best Integration of Dizmo Award” – a use of dizmo on top of Bluemix in a way that leaves Bluemix to resolve the back-end, while dizmo resolves the front-end in farmer-friendly and immediately intuitive fashion. The very valuable outcome of this is that the farmer could, in theory, more easily get on with his job, via better decisions, less wastage and greater crop yields.
“Crop Squares”
This was a project named “Crop Squares”: a square grid that provides information about soil status, crop conditions and the surrounding environment via ‘an array of soil moisture sensors and a weather station’.
The objective was to make use of this data to make the activity of crop irrigation process more optimised, more sustainable and more efficient.
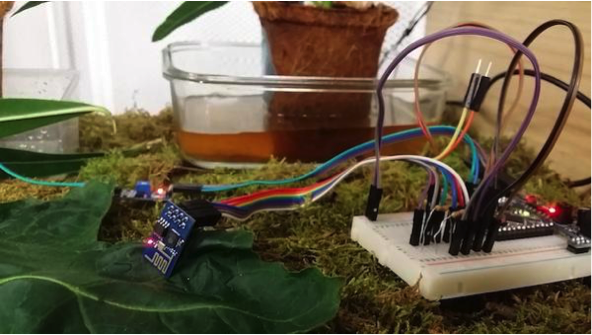
For the hardware the team relied on a Raspberry Pi (+ Raspian OS), weather station (for wind speed and direction sensors), a rain gauge, a DHT22 temperature & humidity sensor, a BMP180 temperature & pressure sensor, an Arduino Pro Mini, Arduino Leonardo and several soil moisture sensors. Further additions were breadboards, jumper wires and resistors, a servo motor, empty bottle or two, four wooden boxes, moss, and a Thymus vulgaris plant.
Bluemix-enabled software back-end
The team compiled Node.js runtime and installed Node-RED workflow tool, to deliver sensor data through IBM Bluemix IoTF MQTT Broker (to which dizmo subsequently subscribed to). Python scripts based on Adafruid Industries libraries read data from the weather station sensors and broadcast them through MQTT.
For the soil probes, they connected a moisture sensor to an Arduino Pro Mini, and then sent all data through an ESP8266 WiFi module.
Finally, an Arduino Leonardo read another moisture probe, activating a servo motor that pushed up a water bottle to perform the irrigation process.
Dizmo-enabled front-end
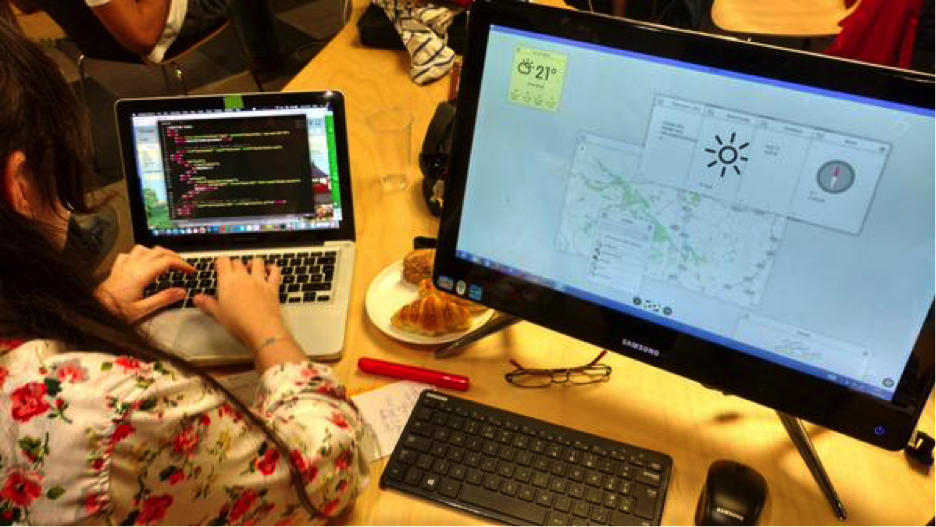
Sensor data collected and posted to the MQTT server visualised on the dizmo User Interface running on a touch screen monitor
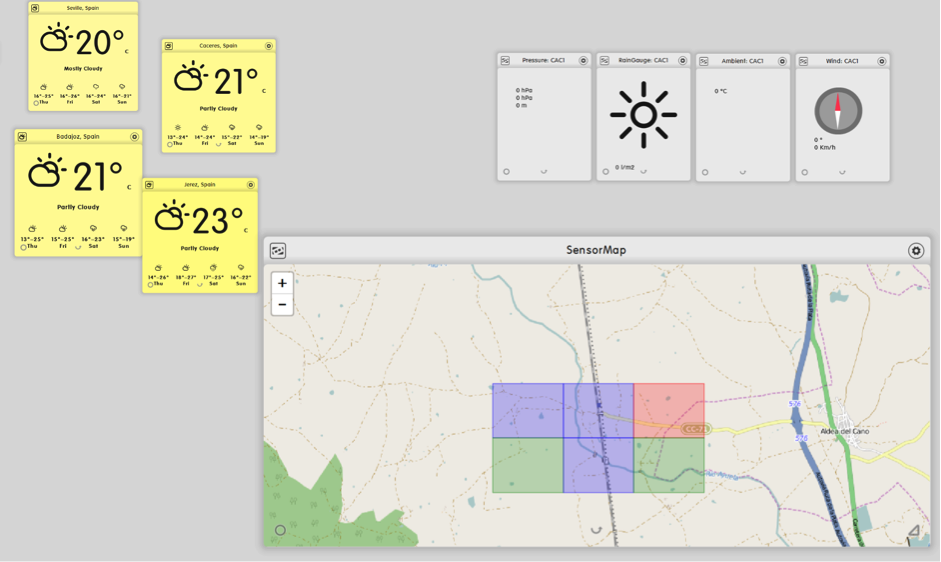
The initial image displayed in this interface is a map of the field made up of rectangular “Crop Squares”. These are rectangles assigned to each soil area around the soil sensors that interactively change their colour depending moisture levels and other factors (green, yellow, red).
By means of a simple touch, these “soil areas” could then be selected to display the weather station results in real time. During the demo the team showed real time data from our weather station with its sensors connected to the Raspberry Pi where variations in soil moisture level by watering some plants updated the color of the first area also in real time.
The screenshot below shows sensor data being retrieved and visualised on the dizmo UI and complemented visually by weather forecast data for the south west region of Spain.
Data Augmentation: extending the viz paradigm
It is also perfectly conceivable that data could be garnered directly from the Spanish Weather Service and fed directly into a dizmo or via Bluemix into the dizmo UI with other related agricultural database information (perhaps also stored in Bluemix).
With dizmo you are not limited to the visualisation of only 1 Active App Per Screen. Rather your UI is now a “space” that can aggregate all types of data, multimedia and apps and also display them adaptively on all digital surfaces and devices in the room, on the car, or even futuristic Free Form Displays on the tractor.
From a usability perspective, it becomes a naturally intuitive, ubiquitous visualisation solution whose only objective it is to help the eventual farmer in his decision making.
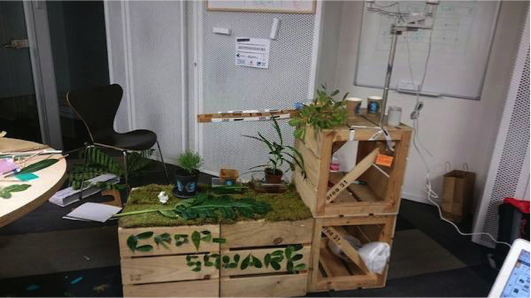
Photo of final prototype. The weather station is mounted on top of two stacked boxes, with the Raspberry, breadboards, Arduinos and servos are inside the lower one. Two empty plastic bottles were placed under the rain gauge to collect water and an impromptu rain gutter (plastic bottle) watered the three plants placed on the lower two boxes. In turn, these plants had moisture sensors that both activated the servo and sent data to the MQTT broker subscribed to by dizmo.
From the developer perspective, what we could see is that a dizmo interface can be developed very quickly where dizmos self-creating other dizmos, overlaying, and combining where it made visual sense.
This is a coding environment where the developer gets to appreciate with all benefits that web technologies entail, but also with additional scope and elaborate functionalities such as “docking” (app2app communication over the UI) and geometry self-awareness of the objects on your UI, much-heightened interactivity, dragging, resizing and arranging objects in vertical hierarchies with multiple content, services, data, apps and objects visible simultaneously in the same space.
The business opportunity
Of course this was an artful and basic prototype, built during scarcely 48 hours of time from conception to creation. It is easy to see future add-ins such as cameras located in and around the crops for real-time vision of crop conditions, or integration of IBM Watson Analytics as the engine to determine the optimal moment to irrigate, and by how much, or additional risks to crops such as excessive temperature, heavy winds and so on.
But, more importantly, it belies the concept of marrying agronomics, climatology and Big Data to get predictability at level much more granular than any national weather service will provide for the farmer. Imagine if farmers could walk through real-time sensor output giving data on what is happening in his field right now and accompany by real-time supporting data for predictive crop yield scenarios? The opportunity for farm efficiency, crop yield and reduced wastage is massive. But if it’s not immediately intelligible, the value of the data is immediately lost.
The baseline principle here is that data needs to be more approachable, more human and able to convey critical insight in ways that go beyond the 2D dimension of the chart and graph – in a way that visually intuitive or the farmer is not going to want to touch it. And a farmer’s son, I can say that.
Team members: Fernando Alvarez-Uria, Gabriel Aldaz, Pablo Lozano, Diego Alvarado, Javier Yuste, Elena Arráez.
Link to project description on Github: https://github.com/fauria/crop-squares